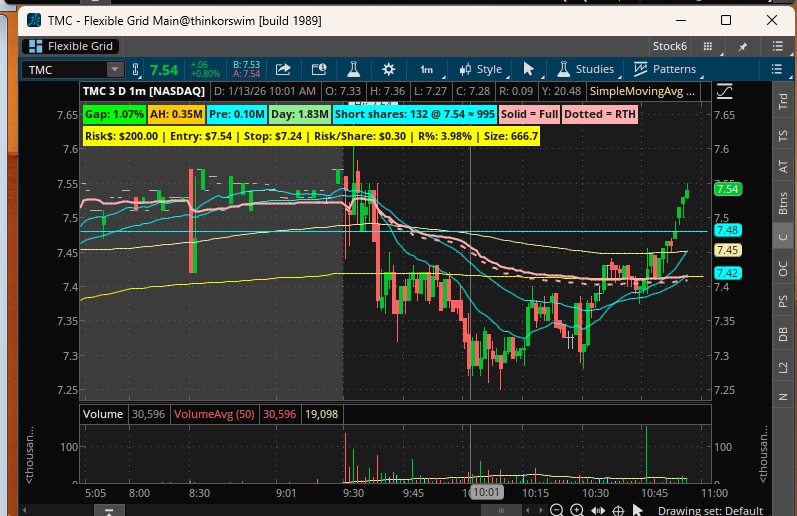
There are multiple community RVOL implementations for Thinkorswim built as watchlist columns, labels, and scanners, typically defined as current cumulative intraday volume divided by expected volume at the same time of day, averaged over N prior sessions. Some scripts also color‑code RVOL buckets (e.g. <1 grey, 1–2 yellow, 2–3 light green, 3–5 orange, ≥5 blue) to highlight “in‑play” symbols directly in the watchlist. You can load these custom studies via TOS’s “Edit Studies & Strategies” and then reference them inside the Stock Hacker scanner as custom conditions